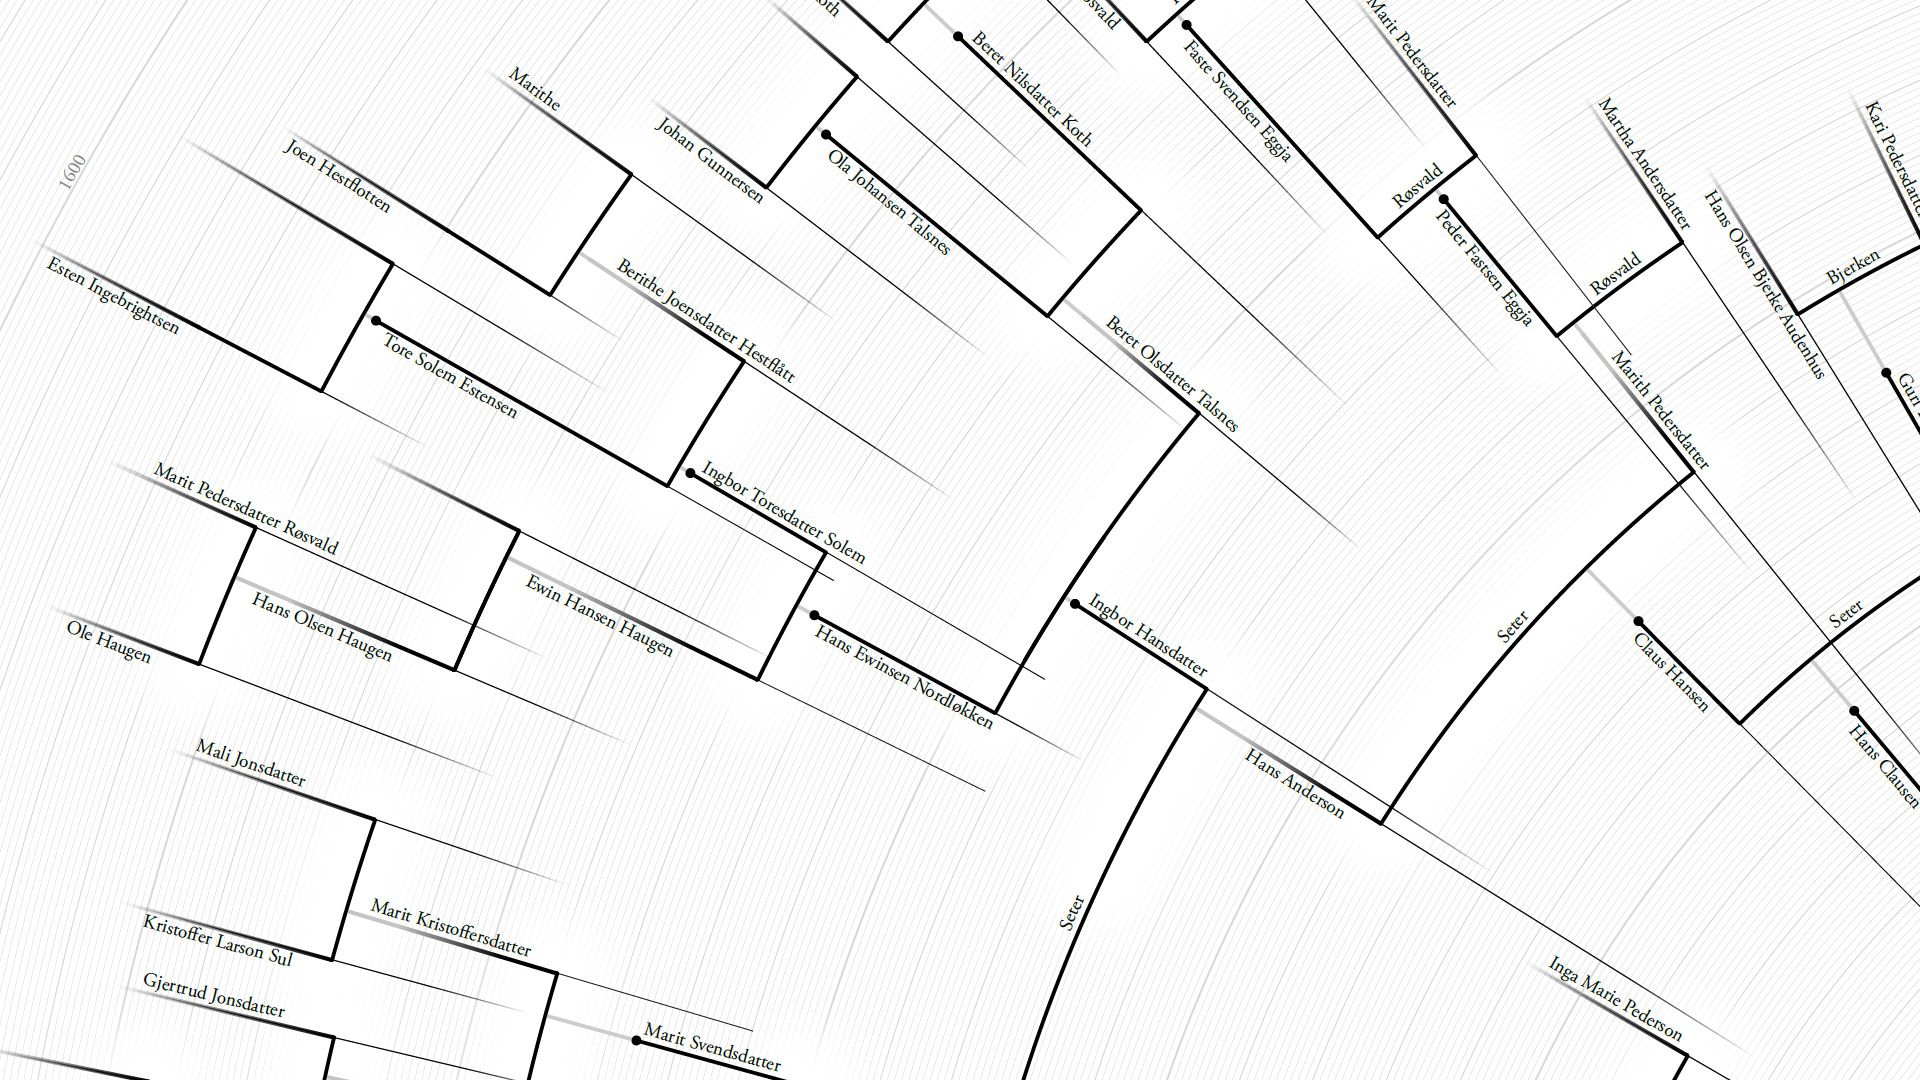
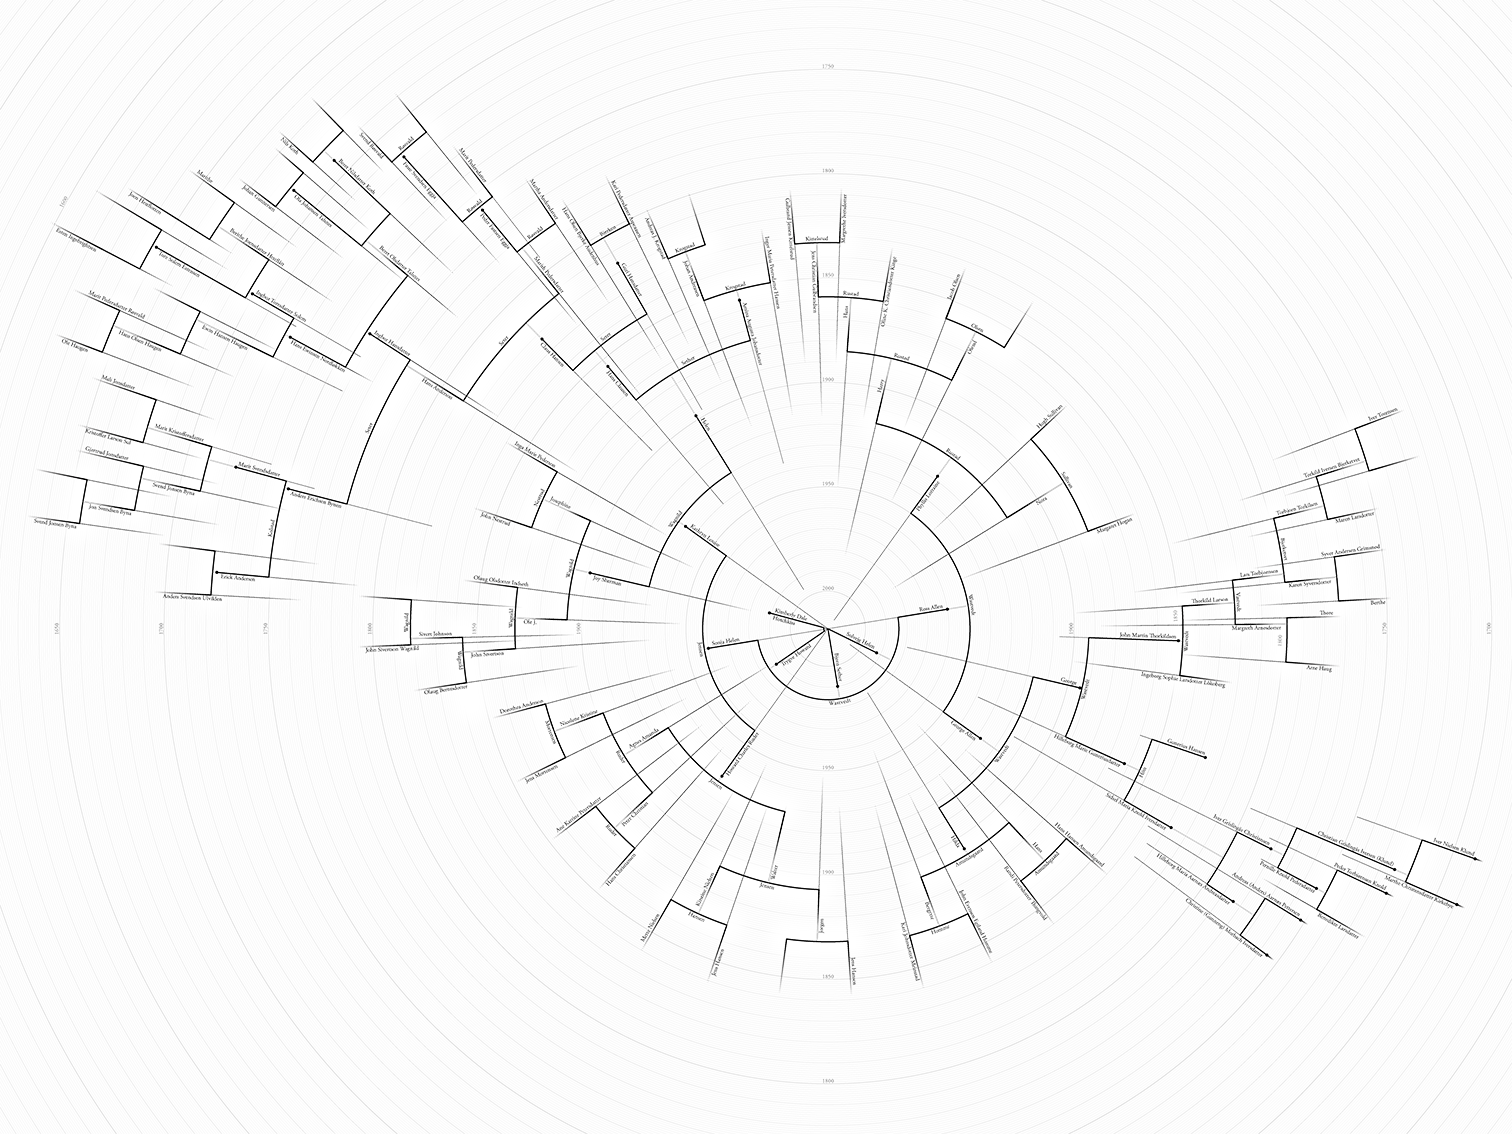
Most visualizations of ancestry focus solely on the blood connections between people and only paint a very general picture of temporal connections. It can be assumed that the people drawn further down the tree lived further back in time, but questions such as who was alive to see a birth or a marriage, or which distant relatives lived at the same time, typically cannot be answered. If one family branch had children early over several generations, ancestors in the same generation, who may appear to have lived at the same time, might in fact not have shared any time at all.
This diagram registers a family tree on a temporal polar grid, answering these questions among others. Each person is represented as a line which starts and ends at the radii corresponding to their birth and death. Marriages, as moments in time, are drawn as arcs. Events for which the date is unknown are represented by faded lines. The resulting diagram allows a gestalt picture of the family history and begins to tell a story of how that history developed.
In tandem with the printed diagram I have developed a digital version using a force-directed graph in d3 to distribute the names. Much work remains to be done, but the initial tests show promise for a layout that adapts to a variety of tree structures.